When a team of researchers is working together towards a common goal – in this case, building a common dataset – we need ground rules to facilitate aggregating our individual contributions. Early on in the project, we realized we needed specific guidelines for the collection of data from very different archival sources. Jane was working on the Toronto files, Sadie on Rockwood, Gabrielle on Grosse Île, and I on Beauport. There were different categories of data that could be transformed into the columns of our Dataset, but there were also many commonalities.
Departing from the commonalities, we put together a document to homogenize the way in which we enter information into our Dataset for the GMM Project. This greatly facilitates the use of mapping tools and visualization software in the future. Although each visualization tool that we will be using has its own rules, and many software programmes interpret data like names, dates, and geographical coordinates differently, we had to adopt a standard protocol. That is why I proposed the following protocols:
1. NAMES
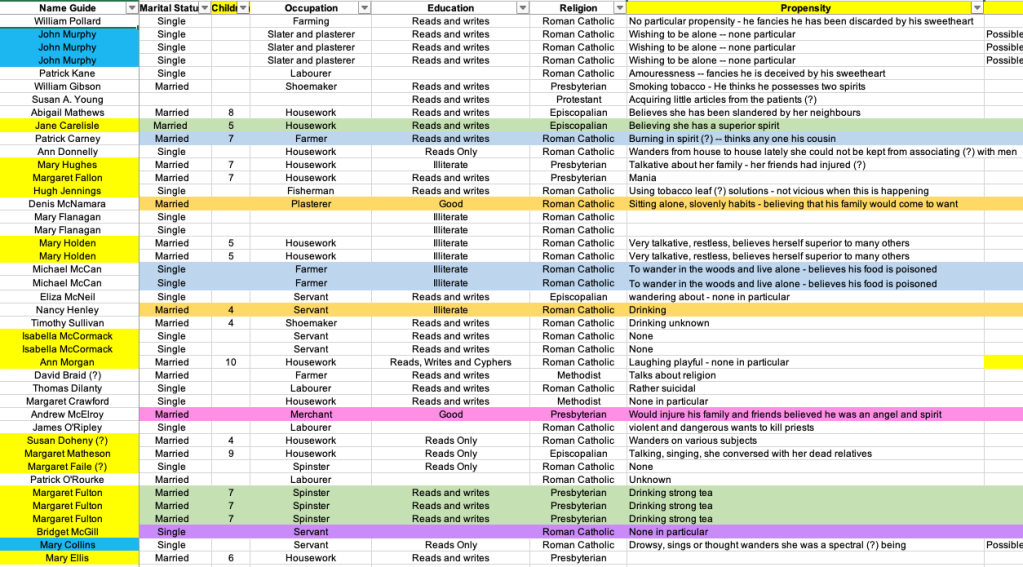
We recommend that names are entered in the format: SURNAME, NAME (example: O’Brien, Bridget instead of Bridget O’Brien) and each in their own column. This facilitates indexing, searching by surname, and alphabetically ordering the thousands of patients we have collected. Grouping all patients in this way enables us to better spot repeated names, find specific patients, and identify any other abnormality in the Dataset. This might not seem like something to worry about initially, but as the number of people that were entered into the Dataset grew, our ability to spot mistakes significantly decreased.
2. IDs
Uniquely identifying people is a common problem that everyone faces when dealing with large datasets. It was problematic that each of us had when we combined our different spreadsheets into one main Dataset for the GMM Project. Everything became confusing. Moreover, we were dealing with patients who were admitted and readmitted several times over the years. This is why we resorted to assigning a unique identification number (ID) to each of our patients. If, for examples, we have different people named “Bridget O’Brien” in different asylums, they won’t be interpreted as the same person, even though the name is repeated. As for re-admitted patients, we copied/pasted their unique ID number that we had initially assigned to them. Overall, this greatly facilitated counting the real total number of patients that we have, allowing us to get accurate results when we do any statistical analysis of the data.
3. PLACES OR ORIGIN, PLACES OF SETTLEMENT (anything geographical really)
Anything that can be found on a map should have its own column in the Dataset. Place names can be linked to an assigned geographical coordinate (longitude, latitude). Geographical places can either be a part of the main Dataset or collected in a separate sheet. This type of data allows us to visualize movement in a map. Movement of peoples are usually considered a migration, but in the GMM Project we are also confronted with the relocation of people within different institutions. In this sense, our data records where the person was born and where the person died or settled, but also to which asylum(s) they were sent. Having this type of data in our sources, we decided to arrange places from the smallest unit to the largest. For example: Castlerickard (parish), followed by Meath (county), and finally Ireland (country). Columns were assigned to each geographical unit following that logical order.
When we had only the biggest units (i.e. country or county) as the only reference location for a patient, then we agreed on a standardized coordinate. It is important to be consistent throughout the Dataset. If it is decided that, for example, Dublin City’s (which has a large metropolitan area) coordinates are 53.35, -6.266667 (x,y or longitude, latitude), then we use the same ones for Dublin City throughout our Dataset. It is key to assign a given coordinate to a place and stick to it throughout because different maps would pick different points and identify them as Dublin City.
Finally, we needed to make a decision on the question of formatting for geographical coordinates. There are many different notation systems, but for our Dataset we proposed to use the decimal notation. Following the example cited above, Dublin City’s coordinates are 53.35, -6.266667, where 53.35 is the longitude and -6.266667 is the latitude.
4. GENDER, MARITAL STATUS & RELIGION
In the original archival sources, we encountered extensive use of abbreviations. For example, patients who were identified as Male were assigned the letter M, and those that were Female, the F. However, this can create confusion. That is why we decided to enter the full word Male/Female into the Dataset. We applied the same logic to marital status, transforming the S into Single, the M into Married, and we chose Widowed for the W to remain gender-neutral. Similarly, we had EC, CofE or CofI for Episcopalian, and RC for Roman Catholic. It is best practice if we do not have to assume what different abbreviations actually mean.
5. DATES
In our Dataset, dates needed to be entered in one unified format. In this case we followed YYYY-MM-DD (Year-Month-Day). It is important that for months and days that have a single digit, like January 9th, we add a 0 before, converting it into 1845-01-09 and not 1845-1-9. In cases in which we know the month, but cannot precisely name the day, Stanford University’s “Mapping the Republic of Letters Project” adopted the day 15 as standard. We also decided to emulate this practice.
7. WORDING
It was very important to homogenize our wording and spelling practices. Different spellings could result in separate and, therefore, false statistics, especially when counting the different patients’ diagnoses, outcomes, or exciting causes.
8. EDUCATION
People’s levels of education were tied to different abilities. These can be enumerated. Instead of entering data about education in long strings of words like “able to read and write” or “reads and writes a little”, we enumerated these in different categories. We entered them in the following way: Reads and Writes; Reads Only; Writes Only; Reads, Writes and Cyphers; Illiterate; Cyphers Only; and Reads and Cyphers. In this way, we are able to quantify how many patients were able to write, read, both, or neither.
In general we tried to leave the cells of our Dataset blank if any data is unknown, and avoided entering punctuation marks like &, ?, or ().
With these rules in place, our Dataset began to take shape and continues to grow.
~ GGG
